How To Read A Pump Curve – Part 1
/By Chad Edmondson
If a picture is worth a thousand words then a pump curve must be worth several thousand.
Make no mistake, there’s a lot of information on a centrifugal pump curve like the one shown here. It’s no wonder that many newly practicing engineers are a little intimated by them. But a solid understanding of pump curves is absolutely necessary for anyone involved in the specification of hydronic equipment.
In this blog, we’re simply going to cover the elements of a pump curve -- more accurately referred to as a “pump performance curve”-- and explain why these elements are relevant to the selection of a pump.
First, it is important to understand that manufacturer’s publish curves for every pump they make. These curves, which are the result of many hours of factory or laboratory testing, tell us how a pump curve will perform under a given set of conditions. Thus, they help us decide which pump is the best selection for a given application.
Here are the main elements of a pump performance curve:
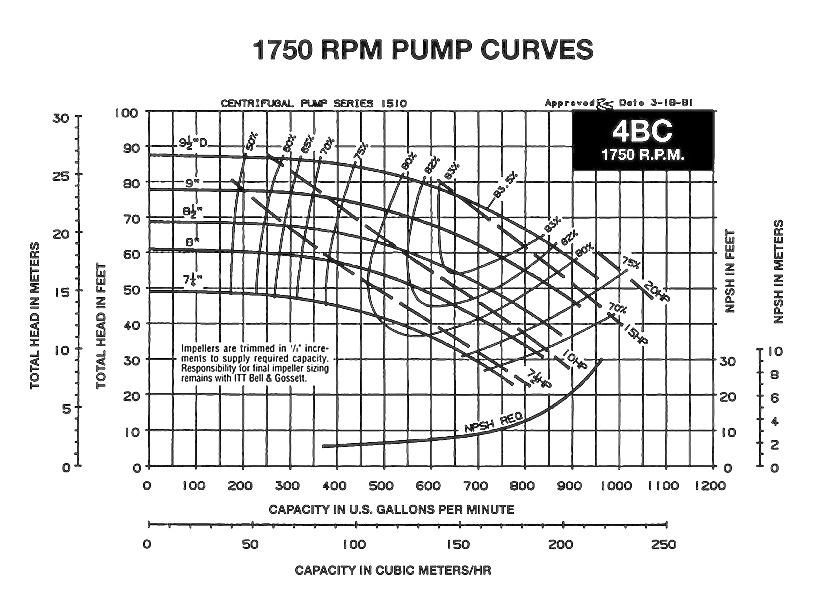
Total Head and Pump Flow Capacity. These are the values that run on the vertical and horizontal axis of the graph.
The total head, shown on the y-axis, is measured in feet and tells us what sort of pressure a given pump is capable overcoming. Hopefully, the engineer will have calculated the total system head (or pressure) the pump will need to overcome in order to get the water where it needs to go. This number is the sum of allresistance values, such as friction head, static head, etc. – virtually any pressure that the pump must overcome to achieve a specific flow.
The pump flow capacity, shown on the x-axis of the pump performance curve, represents the gallons per minute (gpm) that the pump will pump at any given point during its operation.
The corresponding values of the flow capacity and head are plotted on the main curve on the graph at various impeller sizes. This curve tells us exactly how much gpm a pump will deliver under the various total head conditions.
Pump efficiency curves. We consult pump curves not only to see if they can do the work we need them to do – but if they will do it efficiently. Fortunately, manufacturers include this information on the curves as well. These lines intersect with the head-capacity curves and are typically labeled with percentages. Thus, the Bell & Gossett Series 1510 pump curve shown here tells us that this pump with an 8.5” impeller will deliver 600 gpm and a total head of 57 feet at 82% efficiency.
It’s clear by looking at the curve that a pump’s efficiency varies with flow and head. Ideally, you will choose a pump that operates slightly to the left of the Best Efficiency Point (BEP) because typically the pressure in the system is less than what has been calculated. ASHRAE recommends a preferred selection range of 85% to 105% of BEP.
Impeller size. Impeller size or “trim” greatly impacts the pump’s performance. The impeller, of course, is the moving element inside the pump volute, which drives the liquid. The pump performance curve shows the performance of a given pump with multiple size impellers, so the engineer can specify not only the best pump but the best impeller selection as well.
Brake Horsepower. Brake horsepower (BHP) signifies the amount of horsepower required to operate the pump at any given point along the performance curve. These are the straight and sometimes broken lines that typically slope downward from left to right. Brake horsepower varies along with the impeller trim.
Required Net Positive Suction Head (NPSHR). Every pump requires a certain amount of pressure at the suction to operate while delivering the head and flow values shown on its performance curve. If the pump does not have sufficient NPSHR, not only will it not perform as designed but cavitation could also result. Cavitation can cause severe damage to the impeller and the volute. Fortunately, manufacturer’s pump curves also include the NPSH requirement for each operational point along the curve. This is shown in feet of head above the performance curve.
Stay tuned for more information about pump curves and how they can help you make more effective, reliable pump selections.