How To Develop Cooling Tower Life Cycle Cost Analysis: Defining Dry Bulb, Wet Bulb, and Approach
/By Chad Edmondson
In our last blog we suggested incorporating IPLV (Integrated Part Load Values) into your cooling tower lifecycle cost analysis. Next, we need to fill in wet bulb temperatures that correspond with the part load conditions we’ve identified and already added to our lifecycle worksheet.
If you have done the legwork to determine wet bulb temperatures for your climate zone, feel free to use those values. If not, we suggest you use the following wet bulb temperatures which are based on the ARI Air Cooled Dry Bulb Design Points:

As you can see, our load profile consists of the following dry bulb temperatures: 95°F, 80°F, 65°F and 55°F. Notice also the wet blub temperatures shown in blue. These numbers have been derived from the psychrometric chart and are based on the dry bulb temperatures profile at a constant humidity of 47%.
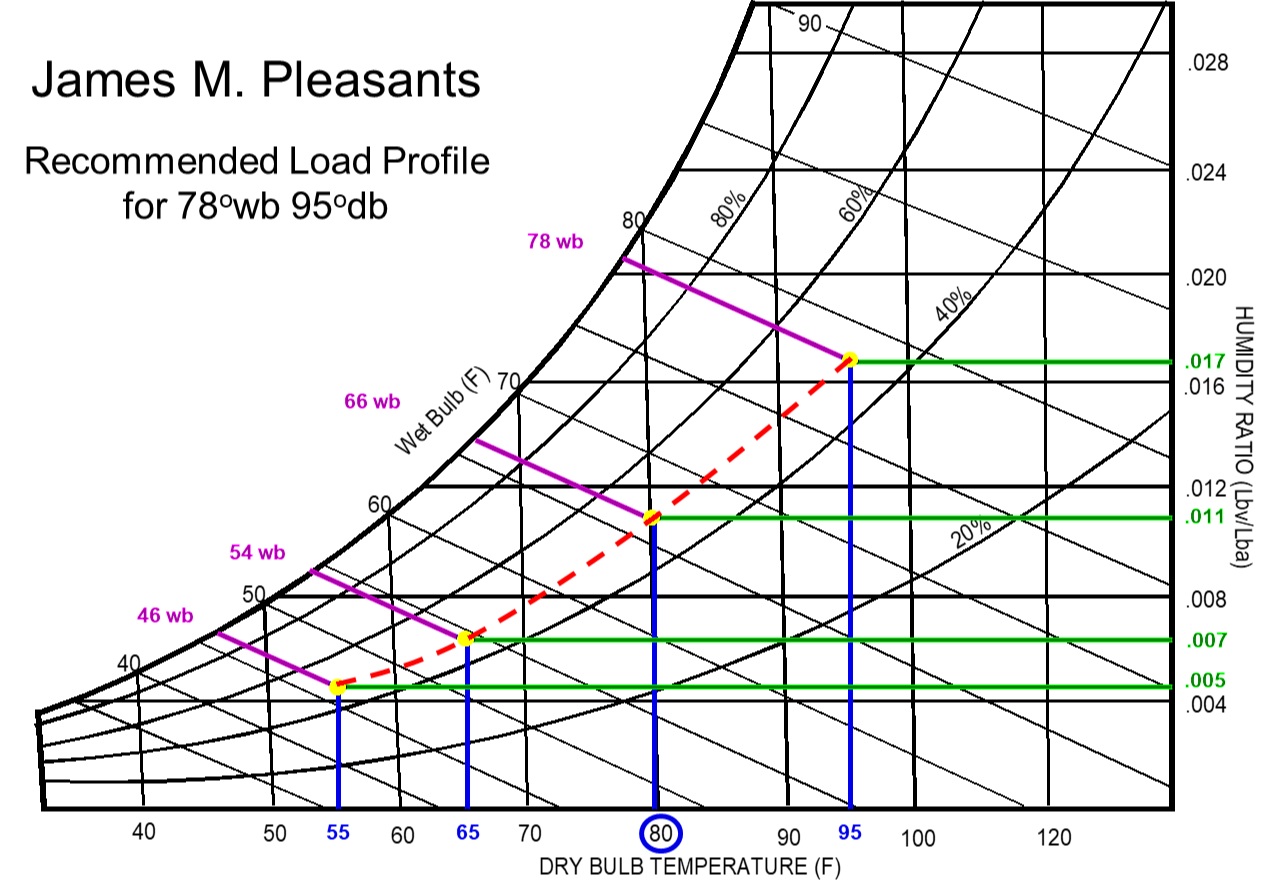
Look at the horizontal axis and you’ll see our dry bulb design points in blue. To determine what wet bulb temperatures would be at these design points, follow the (blue) vertical line from these four dry bulb values up to the curved line that represents a constant 47% relative humidity. From that point follow the purple diagonal line to the left where you find the wet bulb temperature that corresponds with these conditions:

Cold Air Holds Less Moisture!
Notice what happens to the humidity ratio (the amount of water that can be held in a single pound of air at a given temperature). As the dry bulb temperature goes down, so does the maximum amount of water the air can hold at saturation. No surprise, right? Most of us are well aware that cold air holds less moisture. This means cold air will provide less evaporation, and the cooling tower cannot provide as much cooling. However, the significance of this common fact is often underestimated in the role it plays in cooling tower operation. All too often the assumption is that the cooling tower approach stays constant during times of cooler weather. Don’t make that mistake.

Remember -- cooling towers are evaporative machines. If they can’t evaporate moisture into the air then they are not doing the job they are designed to do. So we have to make sure that our load profile reflects the true evaporative capability of the machine under our design point conditions. Specifically, we have to be realistic with our approach and entering wet-bulb temperature in oF. The lower the wet bulb (with a constant approach) the less evaporation we can achieve. The wet bulb temperatures that we propose reflect these realities and help ensure a fair an accurate lifecycle analysis.
So here’s what our worksheet looks like now with our wet bulb temperatures applied. We’ve also done the math for our Yearly Ton Hours (Load Tonnage x Hours of Operation):

At this point you have compiled all the necessary information that the vendor (any vendor for any brand) needs in order to provide you with the fan kw and the annual kw for the model cooling tower you have selected. You are well on your way to being able to make an accurate, apples-to-apples comparison of lifecycle costs of any cooling tower equipment you are considering for your application!