Domestic Water Pressure Booster Sizing Part 3: Estimating Fixture Demand Loads Using Hunters Curve
/By Chad Edmondson
Today we are going to talk about fixture counts and introduce you to the Hunters Curve. Going back to the same simple example we used in Part 1 and Part 2 of this series , we know that each apartment in our 100 Room apartment building has one bathroom group with flush tanks and one kitchen sink. Clearly in a real apartment building you would have more fixtures, but we’re going to keep it simple. The steps for a more complex system are still the same.
Given this information we must now go to the fixture chart below to calculate our total weight in fixture units. This simply is a unit of measure for how much water demand a fixture will require. Where do we find this fixture chart? The State Plumbing Code.
All fixture charts in state’s plumbing codes are based on some edition of the International Plumbing Code (IPC). However, variations do exist, depending on what version the state has adopted, so be sure to go directly to your state’s published code. There, you’ll find a chart that looks something like this:
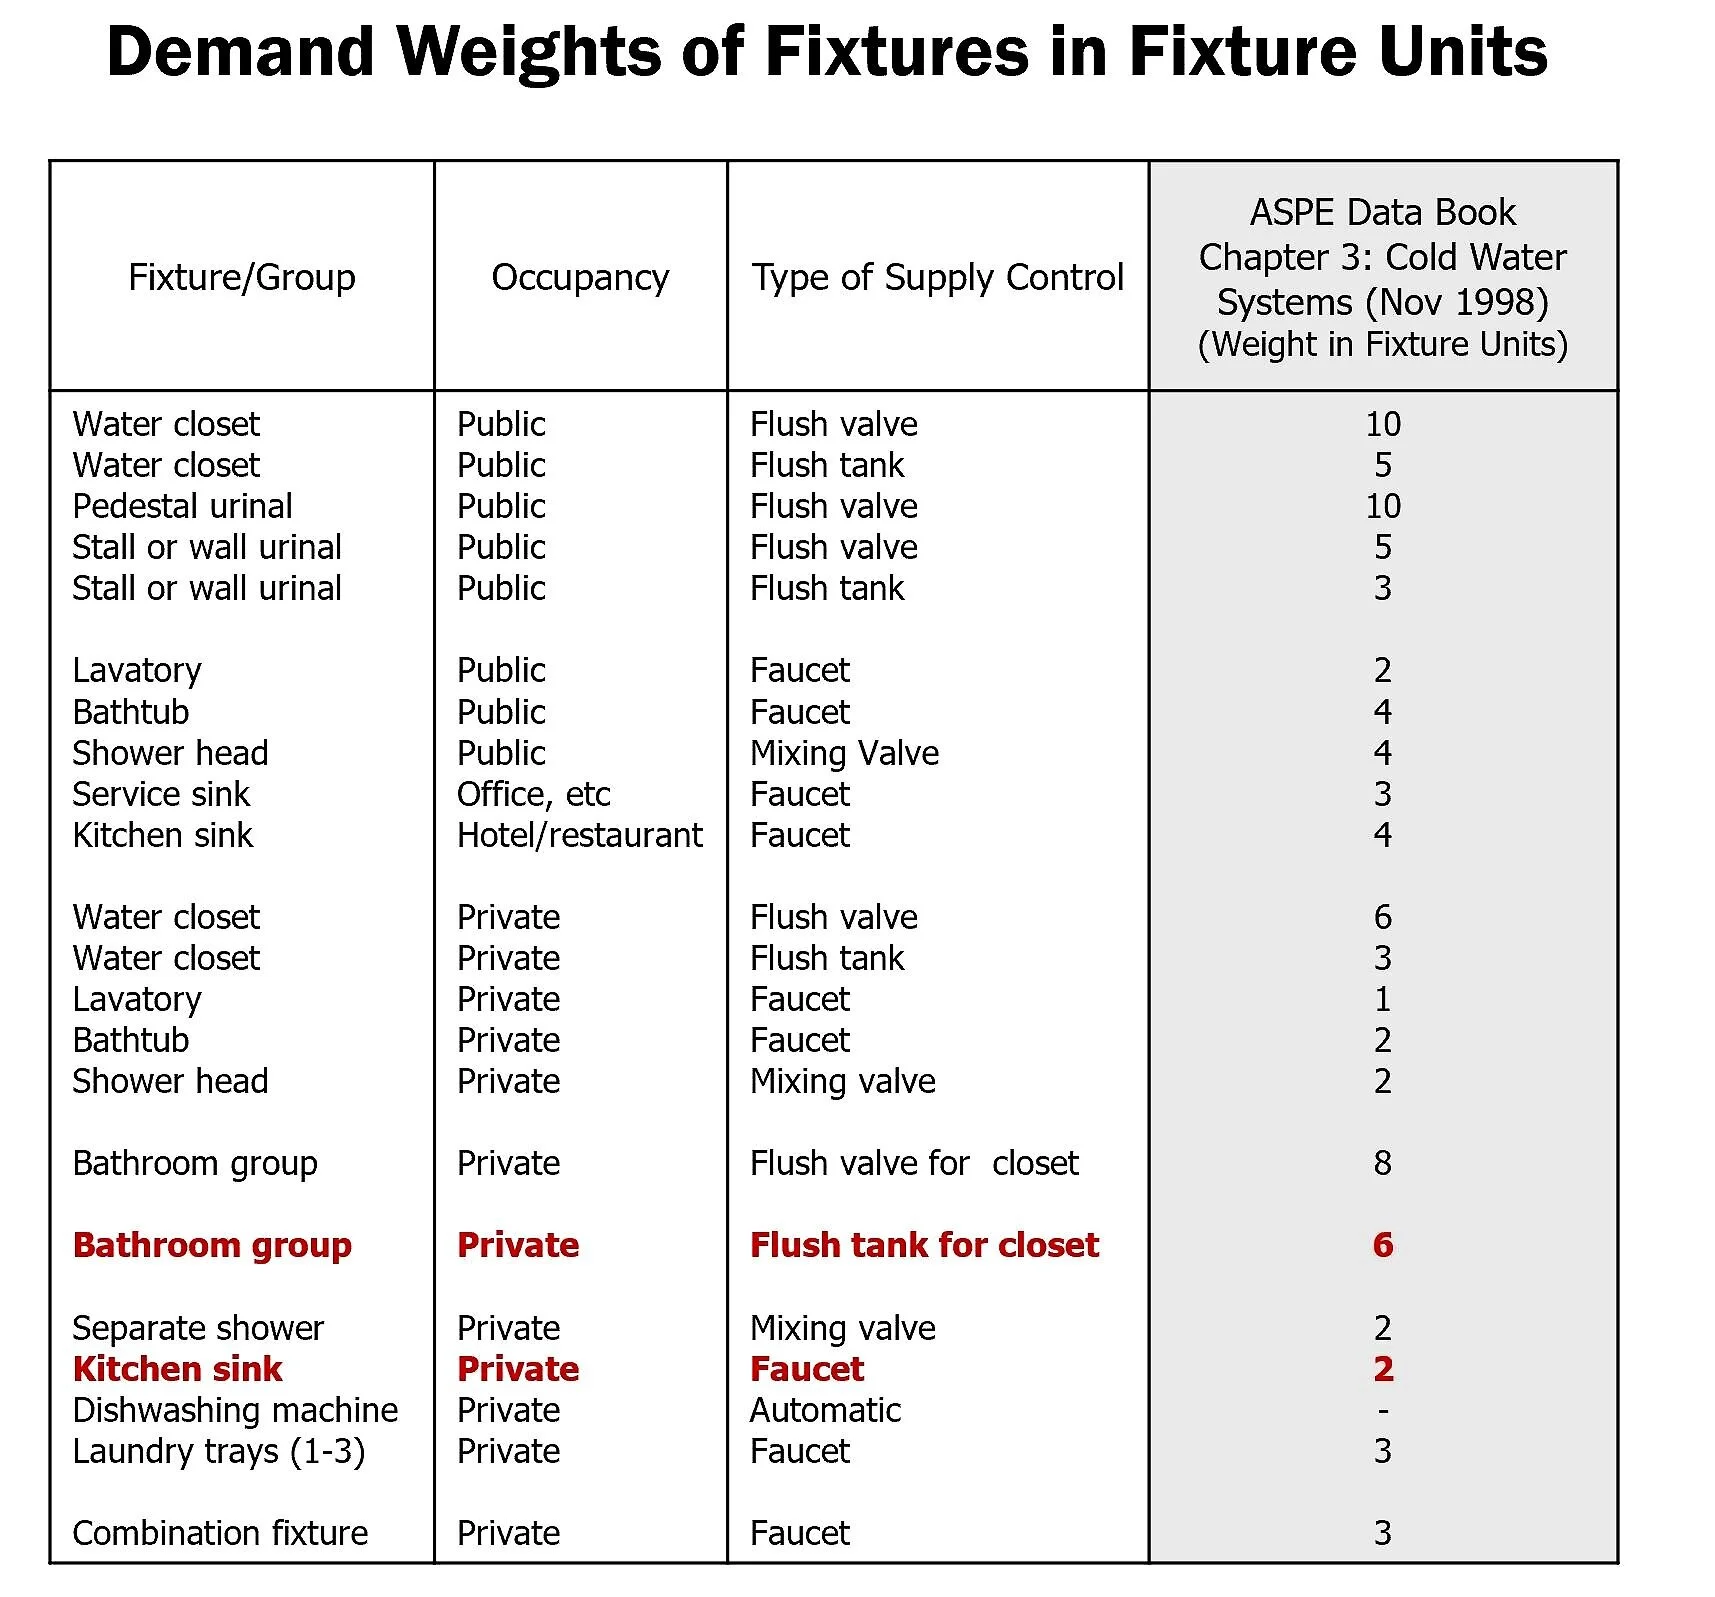
Highlighted in red in the chart above are the fixture units that correspond with our example. There are 6 for the bathroom group and a 2 for the kitchen sink, for a total weight of 8 fixture units. So we have total of 8 fixture units in each of the 100 apartments, giving us a total of 800 fixture units.
How much GPM is required for to satisfy this 800 FU demand? We have to go to the Hunters Curve to find out. This can be found in the IPC.

We simply locate 800 on the horizontal axis and draw a vertical line up to the curve to see where it intersects. As you can see, the demand gpm for 800 fixture units is approximately 180 GPM. Note: The double lines in the lower left reflect systems with flush valves (upper) and flush tanks (lower). Systems with less than 1000 F.U.s will typically use less water if flush tanks are specified. And in case you were wondering, the Hunters Curve is named for Dr. R. B. Hunter, the acclaimed researcher at the National Bureau of Standards from 1921 to 1943, whose decades long study of pipe sizing and probability of use theories resulted in this demand estimating tool that continues to be used today.
With these values filled in, our worksheet is almost complete. Soon we’ll have all the information we need to size our pressure booster.